Description
The mel scale is a perceptual scale of pitches judged by listeners to be equal in distance from one another.
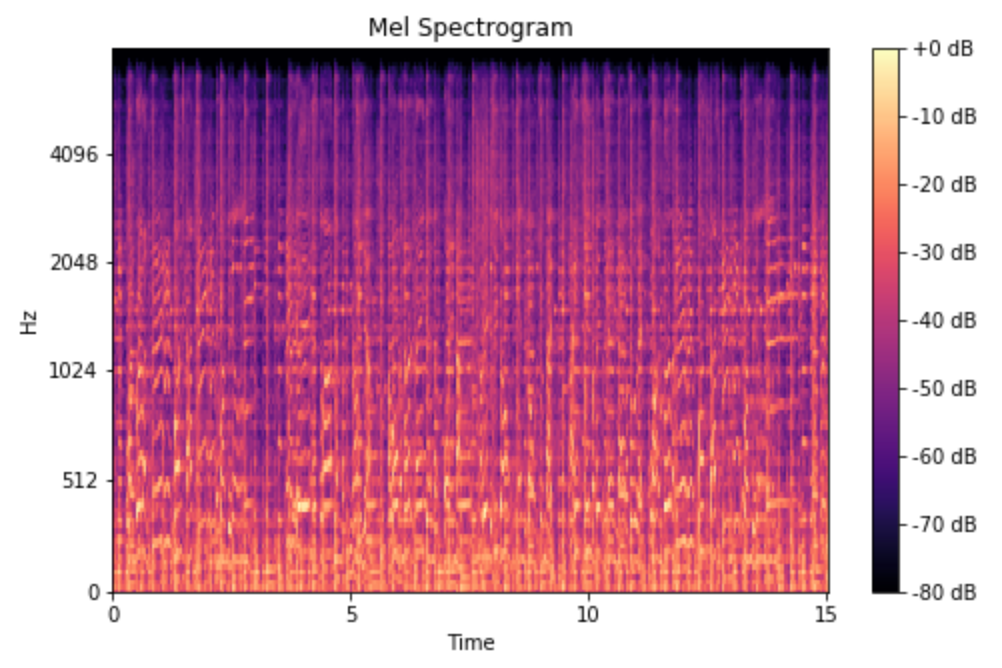
A Mel Spectrogram makes two important changes relative to a regular spectrogram that plots Frequency vs Time.
- it uses the mel scale instead of Frequency on the y-axis.
- it uses the decibel scale instead of Amplitude to indicate colors.
The spectrograms can then be processed with SOTA computer vision models.
Example
